
Extracting Business Model Canvas Insights from Annual Reports (A Weekend Experiment)
Disclaimer
This is a personal technical experiment that I conducted independently and is not associated with, endorsed by, or representative of my employer in any way. It should not be considered financial advice or commentary of any kind. The experiment was performed using publicly available documents from the bank where I work. Any errors or omissions are solely my responsibility.
Table of contents
- Introduction
- PDF’s Into Searchable DB
- Topics Across 10 Years
- Querying with the Business Model Canvas
- Business Model Canvas
- Conclusion
Introduction
Annual reports are rich in information but notoriously hard to mine for structured insights. I wanted to see if modern AI tooling could automatically map 10 years of annual reports into the well-known Business Model Canvas (BMC) framework.
The primary goals were:
- Work within a strict time frame (4–5 hours).
- Process last 10 years of annual reports.
- Build with a minimal tech stack.
- Generate insights using BMC.
- Focus on learning over perfection
PDF’s Into Searchable DB
This script’s job is to read all your PDF reports, chop them into small chunks of text, generate AI embeddings, and save them into a Chroma database so you can later query them with an LLM.
Ingestion (one-time)
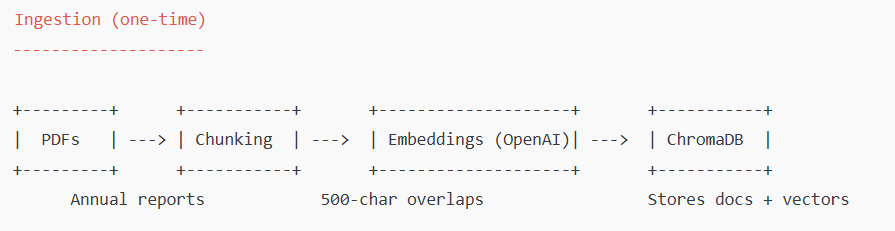
This script turns your PDFs into a searchable database by chopping them into small pieces, converting them into AI-friendly vectors, and storing them in Chroma. Later, you can use this database to ask questions across all your PDFs instead of reading them manually.
I did this experiment on publicly available annual reports from 2015-2024
Topics Across 10 Years
After clustering 10 years of reports, here are the most common recurring themes -
- Customer-Centric Service Approach (4522 chunks)
- Westpac Group Annual Report Summary (3994 chunks)
- Critical Accounting Estimates and Fair Value (3796 chunks)
- Banking Industry Challenges and Strategies (3086 chunks)
- Loans to Directors and KMP (2811 chunks)
- Capital Management and Shareholder Support (2557 chunks)
- Financial Performance Overview (2519 chunks)
- Economic Outlook and Growth Trends (1935 chunks)
- Capital Raising and Director Interests (1930 chunks)
- CEO Transition and Leadership Strategy (1607 chunks)
Most of these are expected for a major bank: customer service, financial performance, and regulatory matters dominate. The most interesting theme for me was CEO Transition and Leadership Strategy, which shows up strongly even though leadership changes are relatively rare.
This script takes all the AI-embedded chunks from your reports, groups them into clusters of related content, then uses GPT to give each cluster a human-readable topic name. Finally, it shows you the top recurring themes across the reports.
Querying with the Business Model Canvas
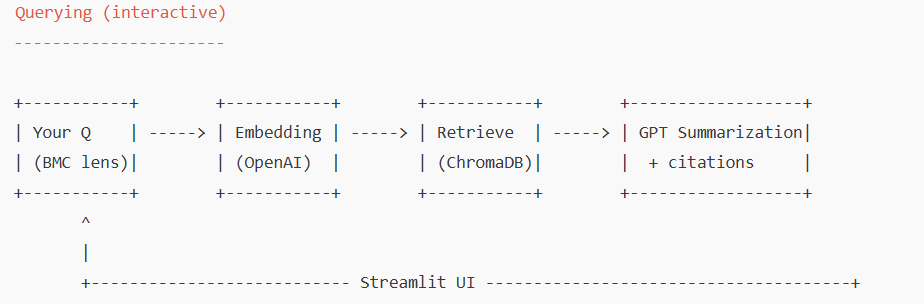
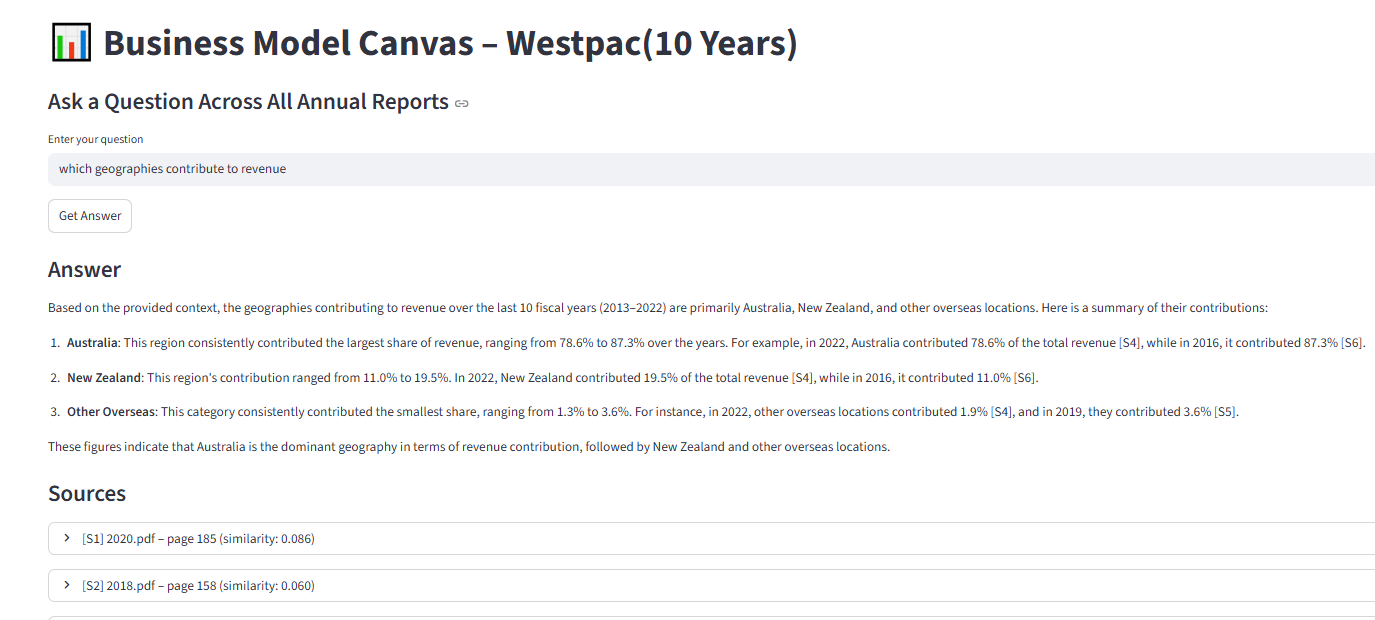
This script builds a Q&A app for your annual reports.You ask a business question (freeform or guided by BMC blocks). It searches the last 10 years of reports. GPT summarizes the findings into a clean, source-cited answer. The streamlit interface looks like below -
Business Model Canvas
The Business Model Canvas (BMC) is a strategic management tool that helps you visualize, design, and analyze a company’s business model. Created by Alexander Osterwalder, it breaks a business down into nine building blocks that capture how the organization creates, delivers, and captures value.
I have highlighted sample questions and responses across all the 9 areas of the business model canvas below
Customer Segments
Who are the company’s main customer groups? Based on the provided context, the company’s main customer groups are geographically segmented, with the majority of revenue coming from Australia and New Zealand. Specifically, Australia consistently contributes the largest portion of revenue, ranging from 78.6% to 87.3% over the years 2013 to 2022 [S1, S4, S6]. New Zealand is the second-largest geographic segment, contributing between 11.3% and 19.5% of revenue during the same period [S1, S4, S6]. There is also a smaller segment labeled “Other overseas,” which contributes a minor portion of the revenue [S1, S4]. Additionally, the company has a substantial number of total customers, with figures ranging from 12.7 million to 14.2 million over the years 2014 to 2022 [S2, S3, S5]. A significant portion of these customers are digitally active, indicating a focus on digital engagement [S2, S3, S5]. However, no single customer accounts for more than 10% of the company’s revenue, suggesting a diverse customer base [S1, S4, S6].
Have the customer priorities changed over time? Based on the context provided, there is limited information specifically addressing changes in customer priorities over the last 10 fiscal years (2013–2022). However, some insights can be inferred from the data on customer behavior and company operations: Increase in Digitally Active Customers: From 2014 to 2018, there was a noticeable increase in the number of digitally active customers, rising from 4.7 million in 2014 to 5.6 million in 2018 [S2, S3]. This suggests a shift in customer priorities towards digital engagement and online services. Decrease in Physical Branches: During the same period, the number of branches decreased from 1,534 in 2014 to 1,204 in 2018 [S2, S3]. This reduction in physical branches could indicate a response to changing customer preferences, with more customers opting for digital interactions over in-person visits. These trends suggest a shift in customer priorities towards digital services and away from traditional branch-based interactions. However, without additional data from 2019 to 2022, it is difficult to provide a comprehensive analysis of customer priority changes over the entire 10-year period.
Value Propositions
How does the company claim to solve customer problems? The company claims to solve customer problems by improving the management of customer complaints and addressing root cause issues. They have implemented several initiatives, such as complaints skilling sessions for bankers to focus on first point resolution, updating their Complaints Management Standard, and making information more accessible. These efforts have led to significant improvements, including reducing the average time to resolve complaints, decreasing the number of long-dated complaints, and increasing the percentage of complaints solved on the same day. Additionally, insights from better complaint management have led to process improvements that reduce pain points for customers [S1][S2][S3].
Customer value The context provided does not include specific information on customer value for the last 10 fiscal years (2013–2022). However, it does provide some data on customer metrics for a subset of those years: Total customers increased from 12.9 million in 2014 to 14.2 million in 2018 [S3, S5]. Digitally active customers grew from 4.7 million in 2014 to 5.6 million in 2018 [S3, S5]. The number of branches decreased from 1,534 in 2014 to 1,204 in 2018 [S3, S5]. These metrics suggest a trend towards digital engagement with customers, as the number of digitally active customers increased while the number of physical branches decreased. This shift could imply an increased focus on digital customer value over the years. However, without more detailed financial or qualitative data on customer value, a comprehensive analysis cannot be provided based on the given context.
Channels
How does the company deliver products or services to customers? The company delivers products or services to customers through a combination of physical branches and digital platforms. Over the last ten fiscal years, there has been a noticeable trend towards digital engagement, as evidenced by the increase in digitally active customers from 4.7 million in 2014 to 5.6 million in 2018 [S1 2018.pdf p.134]. Despite this digital shift, the company still maintains a significant number of physical branches, although the number has decreased from 1,534 in 2014 to 1,204 in 2018 [S1 2018.pdf p.134]. This indicates a dual approach to delivering services, balancing between traditional branch-based services and digital platforms to cater to a broad customer base.
Customer Relations
How does the company maintain customer engagement? The company maintains customer engagement through several strategies: Digital Engagement: There has been a consistent increase in digitally active customers over the years, indicating a focus on enhancing digital platforms to engage customers. From 2014 to 2018, the number of digitally active customers rose from 4.7 million to 5.6 million [S1, S2]. This trend continued with 5.9 million digitally active customers in 2020 [S5]. Service Excellence: The introduction of “Our Service Promise” highlights the company’s commitment to providing exceptional service. This initiative sets clear expectations for delivering great service consistently, which is crucial for maintaining customer engagement [S4]. Branch and ATM Network: Although there has been a reduction in the number of branches, the company has increased the percentage of branches with 24/7 capability, from 27% in 2016 to 36% in 2020 [S5]. This suggests an effort to enhance customer convenience and engagement through improved accessibility. Financial Education: The company also engages customers through financial education initiatives, delivered both face-to-face and online, which likely contributes to customer engagement by providing valuable resources and information [S6]. These strategies collectively demonstrate the company’s efforts to maintain and enhance customer engagement over the last decade
How does management describe building trust or brand loyalty? Management describes building trust or brand loyalty by addressing stakeholder perceptions and expectations. They focus on reducing complexity and resolving issues that could impact customers and reputation, thereby strengthening processes to align with stakeholder beliefs and expectations [S1]. Additionally, they recognize that reputation risk can arise from gaps between stakeholder perceptions and the company’s activities, which can affect the brand positively or negatively. Stakeholder perceptions include views on financial performance, quality of products or services, and management quality [S2].
Revenue Streams
What are the main sources of revenue? Based on the context provided, the main sources of revenue for the company over the last 10 fiscal years (2013–2022) are geographically segmented. The primary sources of revenue are: Australia: This is the largest source of revenue, consistently contributing the majority share. For instance, in 2021, 2020, and 2019, Australia accounted for 85.5%, 85.6%, and 84.2% of the total revenue, respectively [S3]. New Zealand: This is the second-largest source of revenue. In 2021, 2020, and 2019, New Zealand contributed 13.2%, 11.3%, and 12.2% of the total revenue, respectively [S3]. Other Overseas: This category represents the smallest portion of revenue. In 2021, 2020, and 2019, it accounted for 1.3%, 3.1%, and 3.6% of the total revenue, respectively [S3]. These geographic segments provide a clear picture of the company’s revenue distribution over the specified period.
Conclusion
Conclusion This experiment demonstrates how AI and structured frameworks like the Business Model Canvas can transform raw annual reports into actionable insights. By combining PDF ingestion, embeddings, and LLM-powered analysis, I was able to extract recurring themes, map strategic priorities, and answer targeted business questions across a decade of reports.